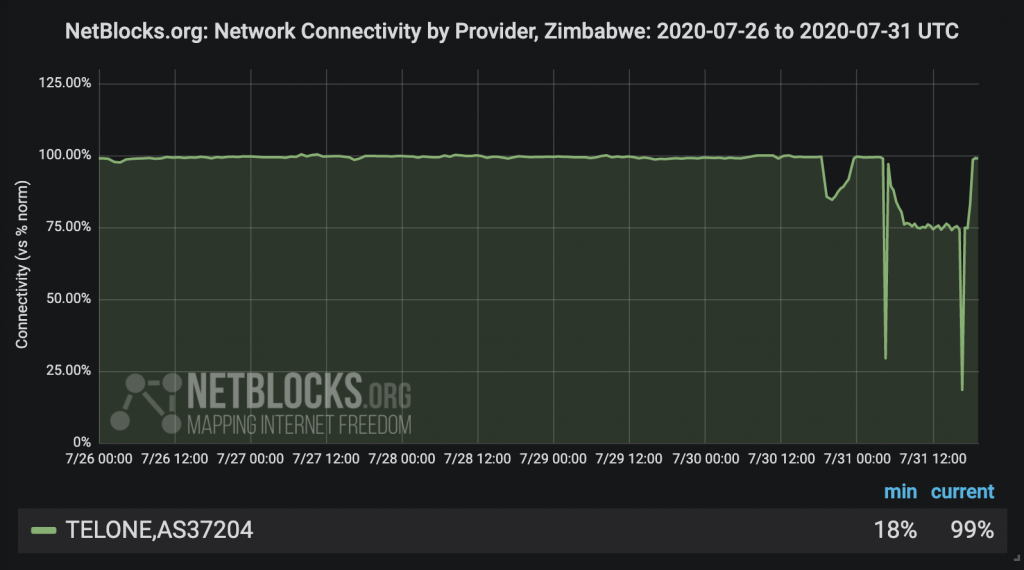
Network data from the NetBlocks internet observatory confirm that internet access has been disrupted in Zimbabwe on Friday 31 July 2020 for a second consecutive day, following a lesser disruption on Thursday.
The incident was widely experienced by users as a slowdown or ‘throttling’ of connectivity speeds on state-owned network TelOne. Authorities have yet to present a court order or basis for the disruption.
⚠️ Confirmed: Real-time network data show partial internet disruption in #Zimbabwe experienced as slowdown or 'throttling' on state-owned provider #TelOne during #July31 protests.
Incident durations:
Thursday: ~5 hours⏱
Friday: ~14 hours⏱? https://t.co/PJW6F0oU2c pic.twitter.com/x6nVNWguzX
— NetBlocks (@netblocks) July 31, 2020
Metrics provide timings of the incidents, which correlate with the times of planned protests:
- Thursday, 30 July 2020: Approximately 5 hours
- Friday, 31 July 2020: Approximately 14 hours
What happened?
Mass-protests over corruption and the economic crisis only partly materialized as authorities imposed a lockdown to counter the spread of COVID-19 following a series of high-profile arrests and demonstrations on Thursday evening.
Zimbabwe’s government warned that participation in Friday’s demonstration would be regarded as insurrection, and news media covered reports of an internet shutdown order hours before incident onset.
While there was no total telecommunications blackout and observed privately owned operators were unaffected, technical data provide evidence of a partial disruption on state-run networks that limited coverage of incidents and arrests.
Technical data corroborate hundreds of user reports detailing difficulties accessing online services during the period in question. Subscribers additionally note that the service provider’s help desk was unresponsive, while VPN services were found to be effective in circumventing the disruptions and restoring access to social media.
Just noticing that @TelOneZW internet has improved, this is after a whole day of slow and erratic internet connection.
— Sharon Mazingaizo (@sharonmufaro) July 31, 2020
@TelOneZW kindly explain why you internet is slow today. Taking minutes to load a tweet
— Gil Kamusasa (@gilkamusasa) July 31, 2020
NetBlocks recommends against the use of network disruptions to limit the rights to free expression and free assembly.
Further reading:
- #ZimbabweanLivesMatter emerges as citizens protest Mnangagwa govt – ITWeb Africa
- Real-Time Network Data Shows Partial Internet Disruption In Zimbabwe On 30 & 31 July 2020 – Pindula
- Partial Internet Disruption In Zimbabwe – Mbare News
- How much will an internet shutdown cost the Zimbabwean economy? – TechZim
Background: Zimbabwe’s 2019 fuel protest internet shutdown
On 15 January 2019, protests against the rising price of fuel swept Zimbabwe triggering a political backlash. NetBlocks reported internet shutdowns which rapidly proceeded to have nation-scale impact.
Update: 1:00PM UTC – much of #Zimbabwe now fully offline; a few still have highly restricted access but face blanket ban of online platforms including Twitter, Facebook, WhatsApp, even Pinterest and Tinder #ZimbabweShutdown #KeepItOnhttps://t.co/svNQeLresu pic.twitter.com/c9pKQCtFWm
— NetBlocks (@netblocks) January 15, 2019
Further reading on previous NetBlocks reports:
- Zimbabwe cracks down violently on fuel protesters – Financial Times
- Zimbabwe’s internet crackdown shows the ‘economic sabotage’ of shutdowns – PRI
- Zimbabwe protests: #ThisFlag pastor arrested on final day of protests – AfricaNews
Methodology
NetBlocks diffscans, which map the IP address space of a country in real time, show internet connectivity levels and corresponding outages. Purposeful internet outages may have a distinct network pattern used by NetBlocks to determine and attribute the root cause of an outage, a process known as attribution which follows detection and classification stages.
A summary of data visualizations used in this report:
- Network Connectivity (National): Internet providers and networks serving the affected region are visualized in a stacked time-series histogram to identify the start and end times of an internet shutdown event. Scales on the y-axis are adjusted to match localized maxima while minima indicate periods when networks became unreachable. The x-axis represents Universal Coordinated time (GMT+0).
- Standard: Connectivity levels on the y-axis correspond directly to the observed number of reachable connections, as with National Connectivity charts.
NetBlocks is an internet monitor working at the intersection of digital rights, cyber-security and internet governance. Independent and non-partisan, NetBlocks strives to deliver a fair and inclusive digital future for all.
[ press | contact ] Graphics and visualizations are provided for fair use in unaltered form reflecting the meaning and intent in which they were published, with clear credit and source attribution to NetBlocks. Intellectual property rights are protected including but not limited to key findings, facts and figures, trademarks, copyrights, and original reporting, are held by NetBlocks. Citation and source attribution are required at the point of use.

